With FlexSync, you can run Shopify’s built-in analytics reports and export the results directly to Google Sheets. Browse ready-made reports, customize existing ones, or create your own ShopifyQL queries. Each report is automatically written to its own tab in your Google Sheet.
Access the Analytics page #
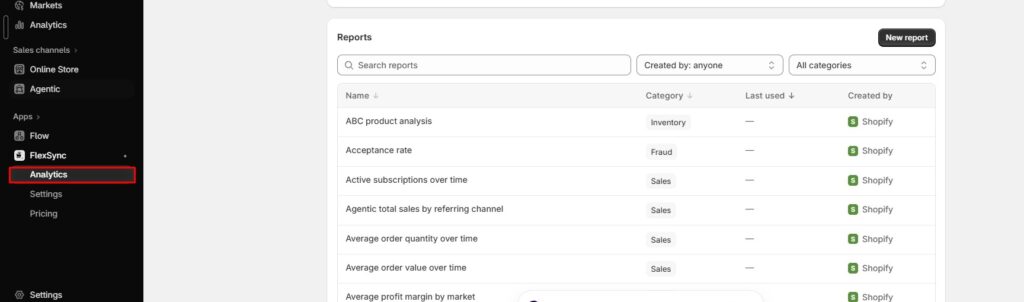
- In your Shopify admin, open FlexSync → Analytics.
- You’ll see a library of ready-made Shopify reports, grouped by category (sales, inventory, profit, behavior and more).
Find a report #
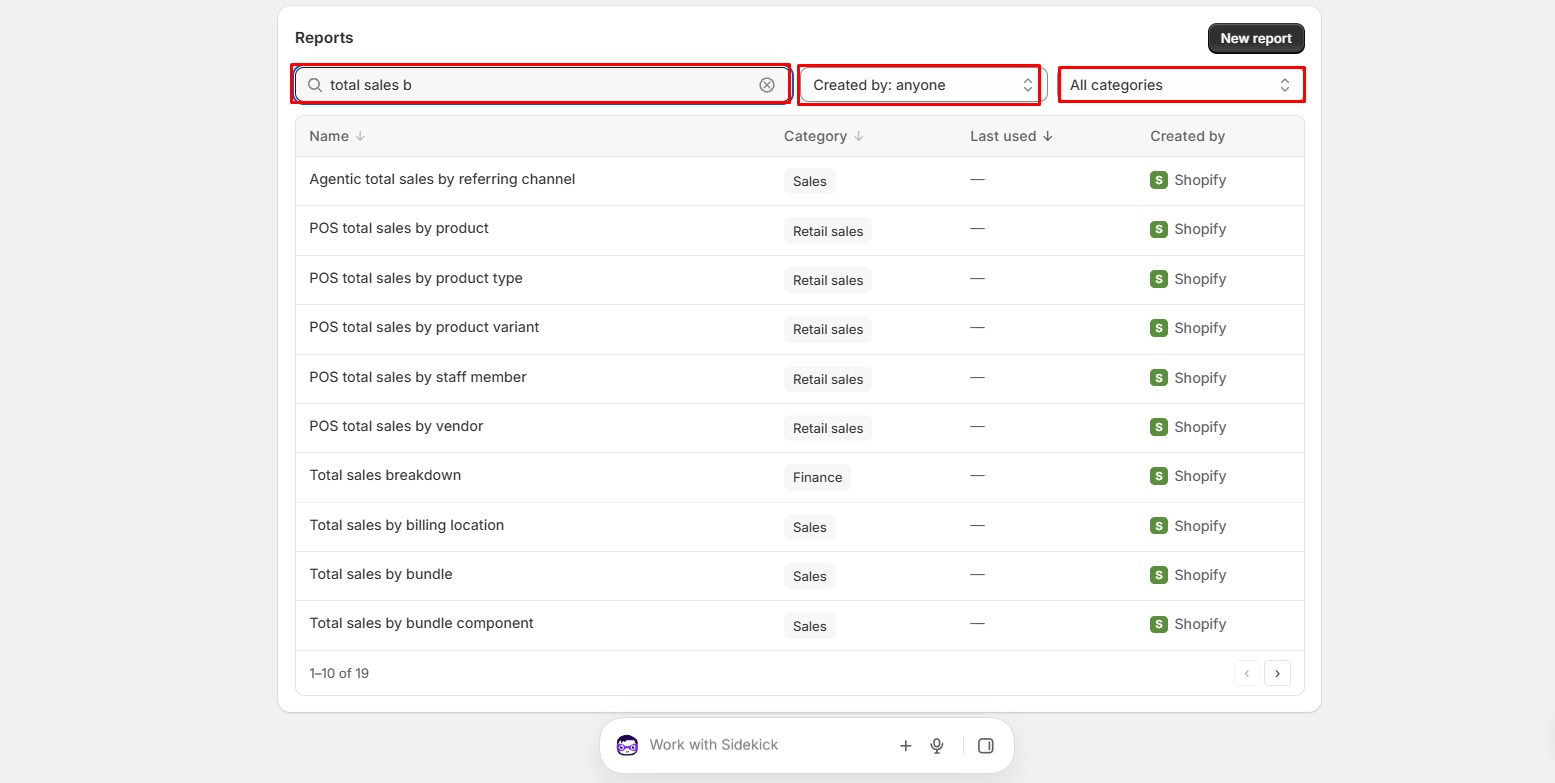
- Type in Search reports, or narrow the list with Created by and All categories.
Run a report #
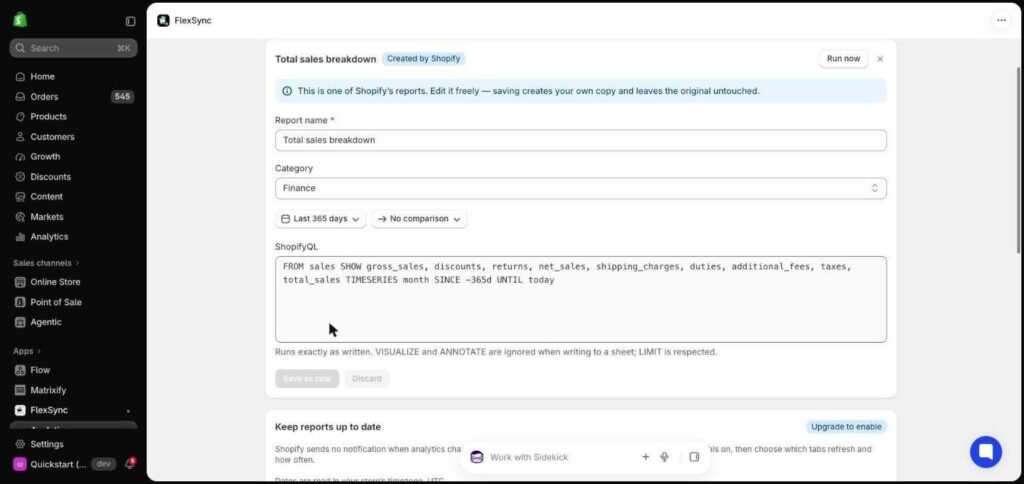
- Click a report to open it. For example, Total sales breakdown.
- Choose a date range (for example, Last 365 days). You can also compare it with an earlier period.
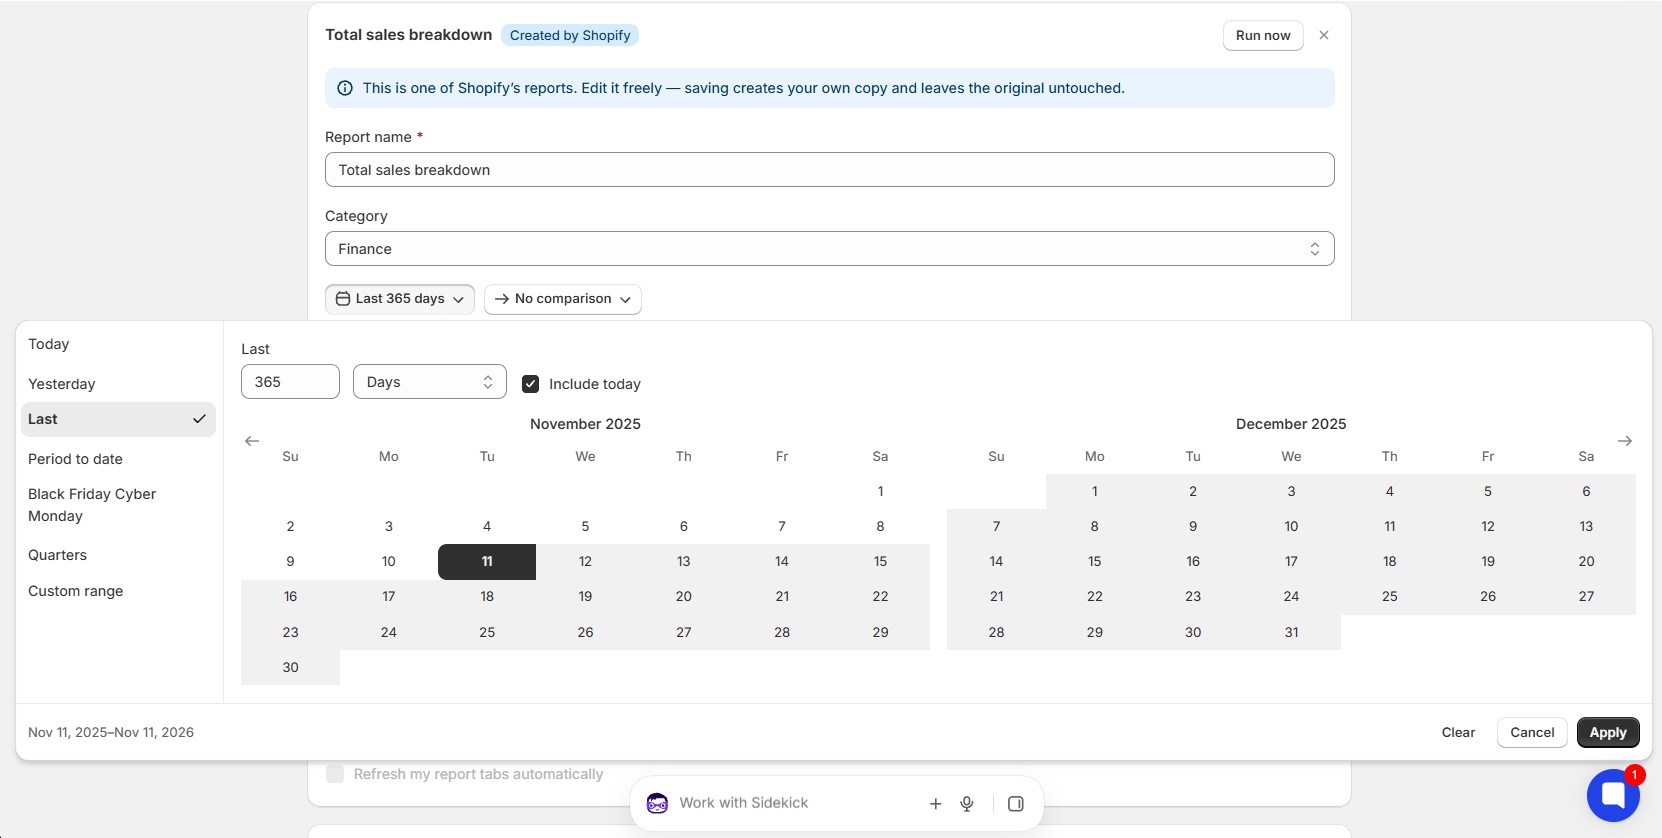
- Click Run now.
- When it finishes, you’ll see Written to “Total sales breakdown”. Open your Google Sheet to find the new tab.
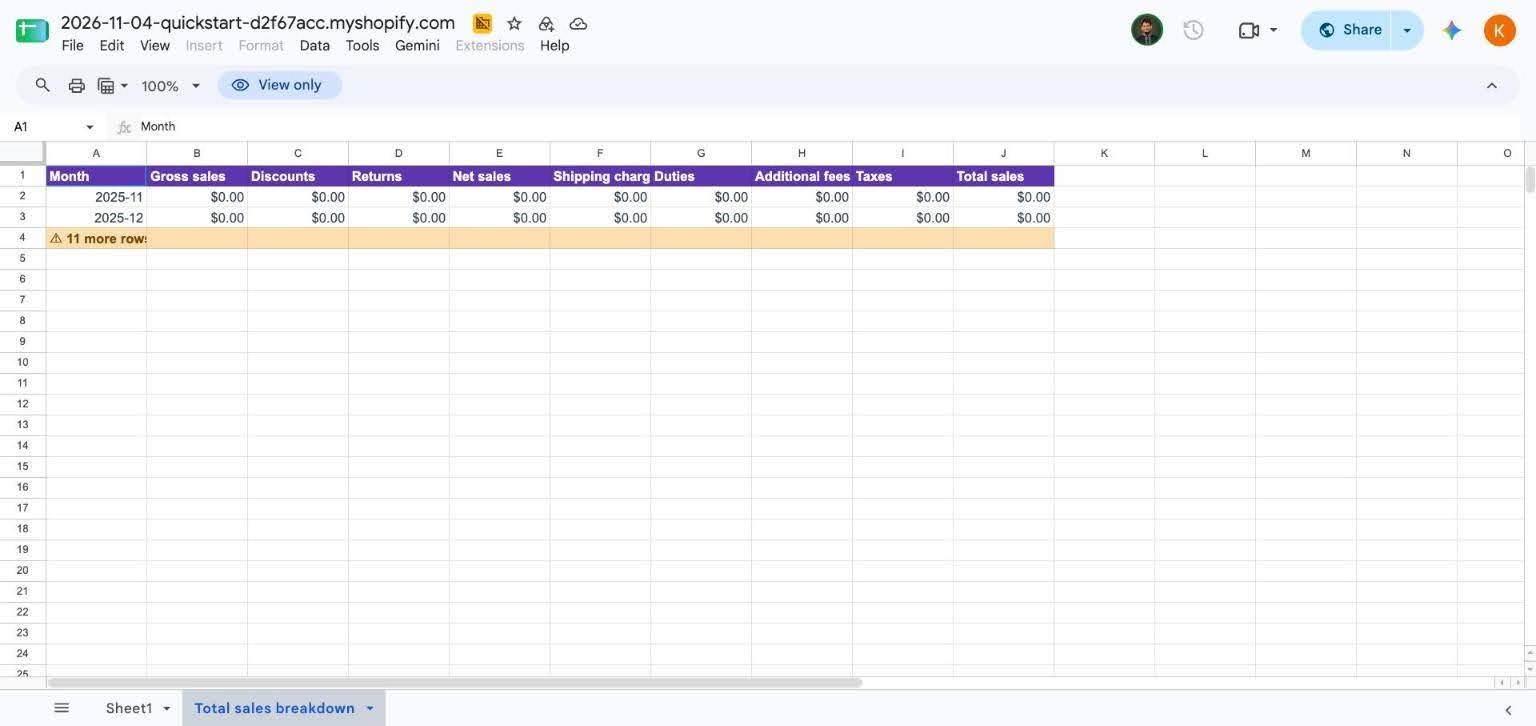
On the Free plan, a report writes up to 2 rows and you can keep 1 report tab. The sheet shows how many more rows are available on a paid plan.
Edit a report or write your own #
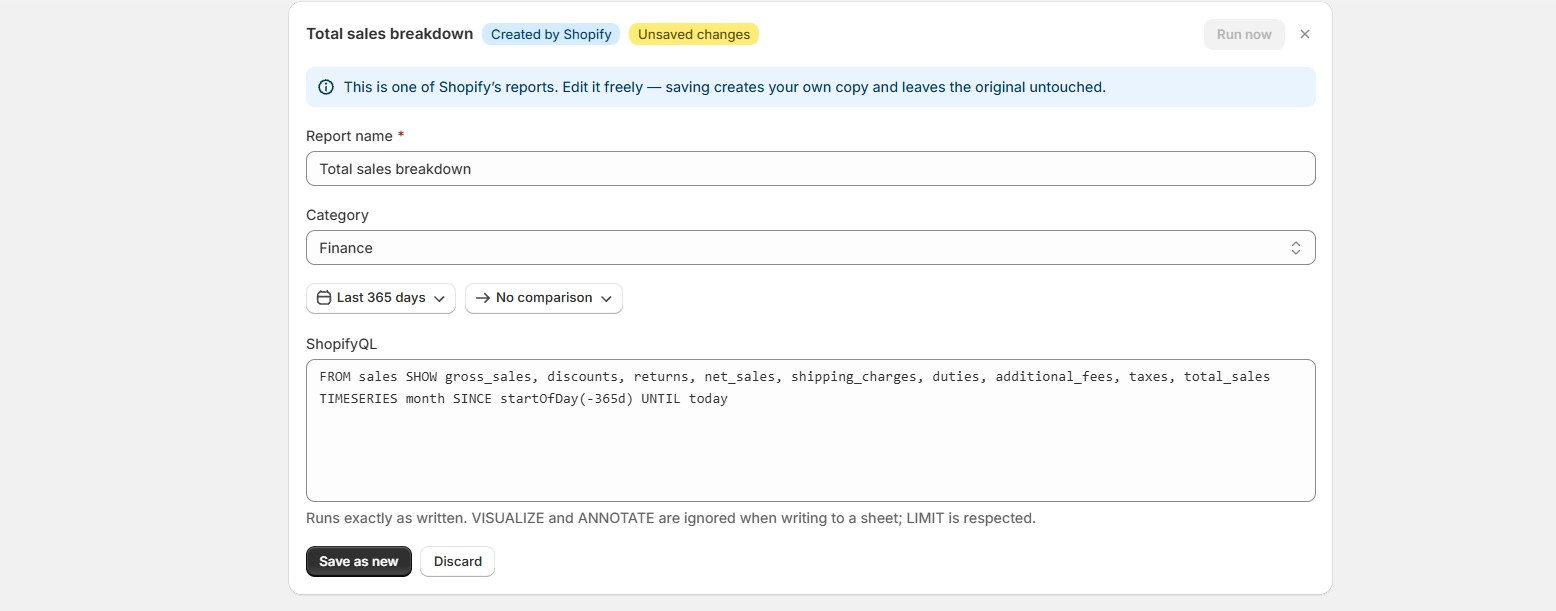
- Every Shopify report can be edited. Saving creates your own copy, and the original stays untouched. Click Save as new to keep your version.
- Click New report to write your own ShopifyQL query from scratch.
Keep reports up to date (paid plans) #
Shopify doesn’t notify apps when analytics change, so a report tab keeps the data from its last run. On paid plans, turn on Refresh my report tabs automatically, then choose which tabs refresh and how often: hourly, daily or weekly.
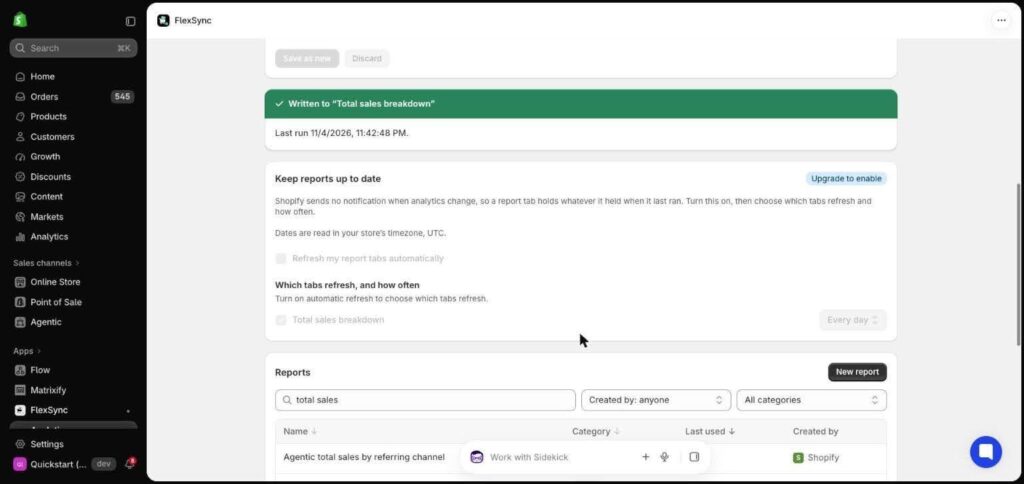
On the Free plan this section shows Upgrade to enable. Dates are read in your store’s timezone.
Tutorial: #
Need help? #
Need assistance setting up your analytics reports or writing custom ShopifyQL queries?
Reach out to our support team through Live Chat inside the FlexSync app, or book a setup call directly from the setup page.
