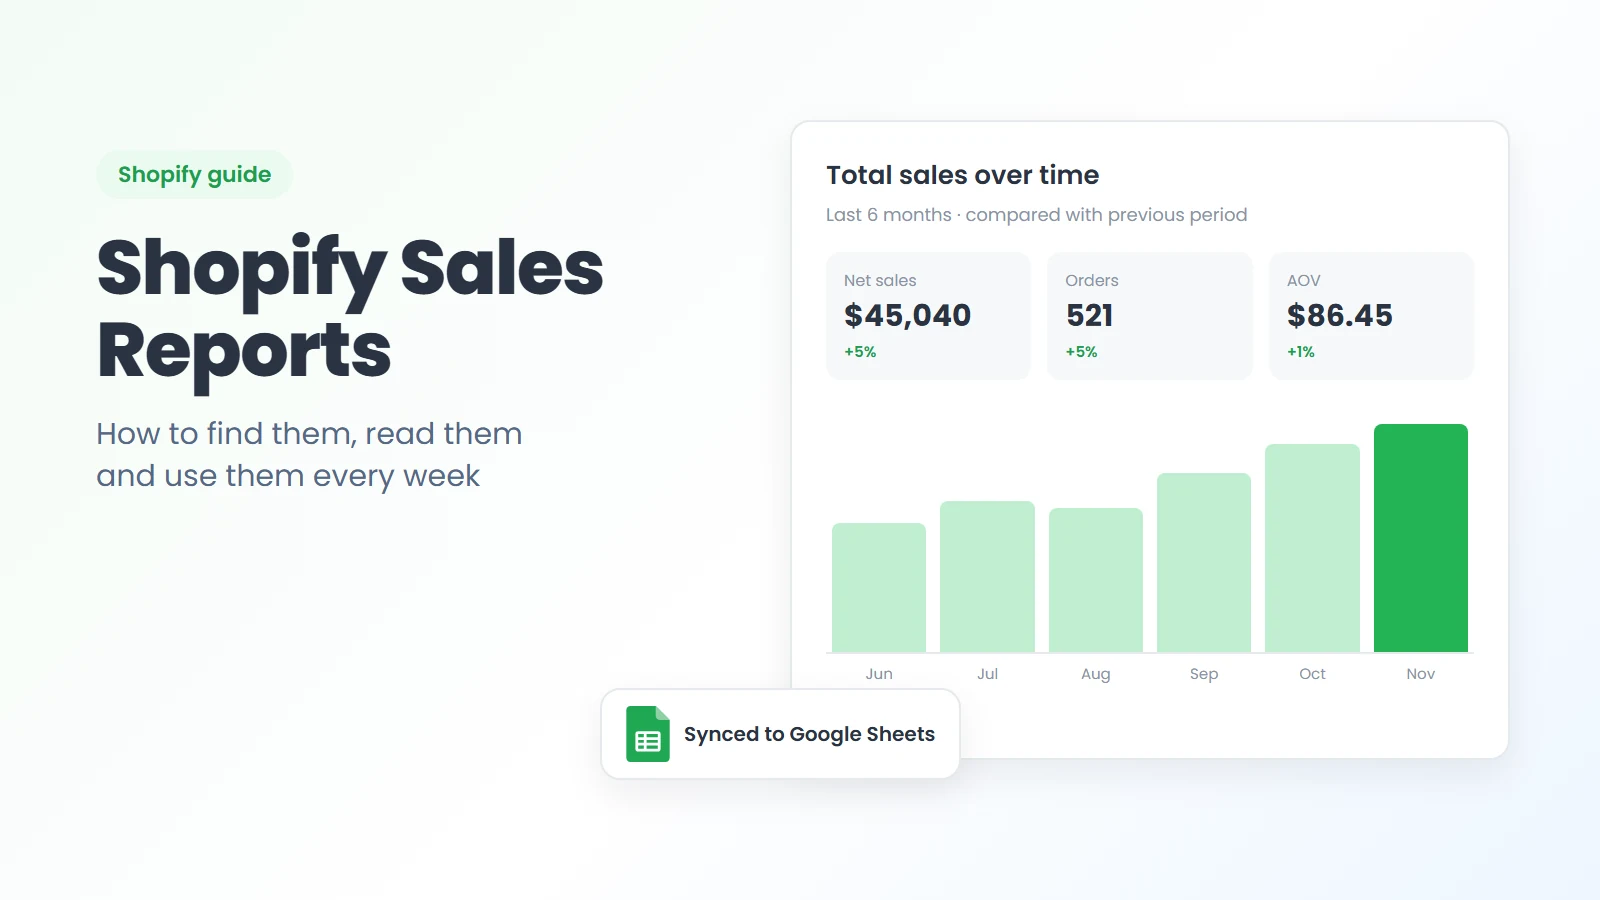
Shopify sales reports tell you what you sold, when you sold it and where the money came from. Most store owners open them only when something feels off. That is a missed chance.
This guide shows you where to find your Shopify sales reports and how to read each number. Then we turn them into a weekly habit. You will also see how to send any sales report to Google Sheets, so the numbers update on their own.
QUICK ANSWER
To find Shopify sales reports, go to Analytics > Reports in your Shopify admin, click the Category filter and choose Sales. Open a report such as Total sales over time, pick a date range and click Export to download a CSV. To keep a sales report in Google Sheets on a schedule, run it with an app like FlexSync.
Table of Contents
What are Shopify sales reports?
Shopify sales reports are built into your admin. They group your orders by time, product, channel, customer or discount. Each one shows what you sold, minus discounts and refunds, plus shipping and tax.
They are not payment reports. A sales report counts a sale on the day it was made. It does not show when the money reached your bank. For that, Shopify points you to its finance reports, as the Shopify Help Center guide to sales reports explains.
The data is close to live. Shopify says a sales report is up to date within about one minute, and you can refresh it to see newer orders.
How to find your sales reports in Shopify
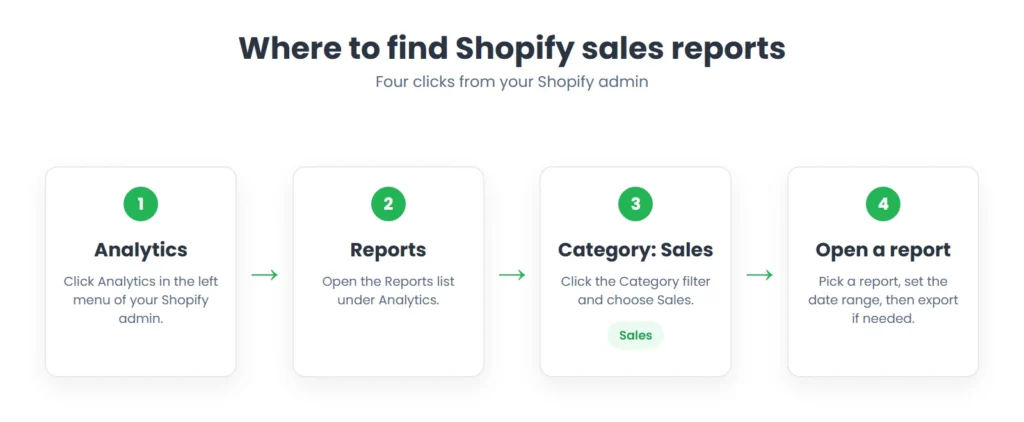
- From your Shopify admin, click Analytics.
- Click Reports.
- Click the Category filter and choose Sales.
- Open the report you need, for example Total sales over time.
- Set the date range at the top. You can also compare it with an earlier period.
- Click Export if you want a CSV copy.
You can also ask Sidekick, Shopify’s built-in assistant, a plain question such as “Why did my sales drop this week?” It will point you to the right report.
Which Shopify sales report should you open?
There are dozens of sales reports. You rarely need more than a handful. Start with the question you want answered, then pick the report.
| Your question | Report to open |
|---|---|
| Are sales going up or down? | Total sales over time |
| Which products bring in the most money? | Total sales by product |
| Which sizes or colors sell best? | Total sales by product variant |
| Which channel sells the most: online store, POS or another app? | Total sales by sales channel |
| Which websites send buyers who actually pay? | Total sales by referrer |
| Are my discount codes worth it? | Sales by discount codes |
| Is my average basket growing? | Average order value over time |
| Who are my best customers? | Sales by customer name |
| How much am I losing to refunds and edits? | Total sales reversals over time |
| Which days of the week are busiest? | Weekly sales patterns |
Report names can change as Shopify updates its analytics. The names above match the Sales category as of November 2026.
How to see a daily sales report or historic sales
Open Total sales over time. Use the Group by menu to show sales by day, week, month or year.
For a daily sales report, set the date range to Last 30 days and group by day. For historic sales, pick a custom date range that goes back as far as you need. Then compare it with the same period last year to see real growth.
How to read a Shopify sales report
Every Shopify sales report uses the same core terms. Once you know them, any report is easy to read.
| Term | What it means |
|---|---|
| Gross sales | Product price times quantity, before discounts, reversals, shipping and taxes. |
| Discounts | Money taken off by discount codes or automatic discounts. Compare-at prices are not counted here. |
| Sales reversals | Refunds, returns, cancellations and order edits that lower a sale. These used to be called returns. |
| Net sales | Gross sales minus discounts minus sales reversals. |
| Shipping | Shipping charged, minus shipping discounts and refunded shipping. |
| Taxes and duties | Taxes and import duties collected on the orders. |
| Total sales | Net sales plus shipping, taxes, duties and fees. |
| Average order value | Gross sales minus discounts, divided by the number of orders. Later edits are left out. |
Gross sales, net sales and total sales: a simple example
Say your store had $10,000 in gross sales last month. Customers used $800 in discount codes, and you refunded $400.
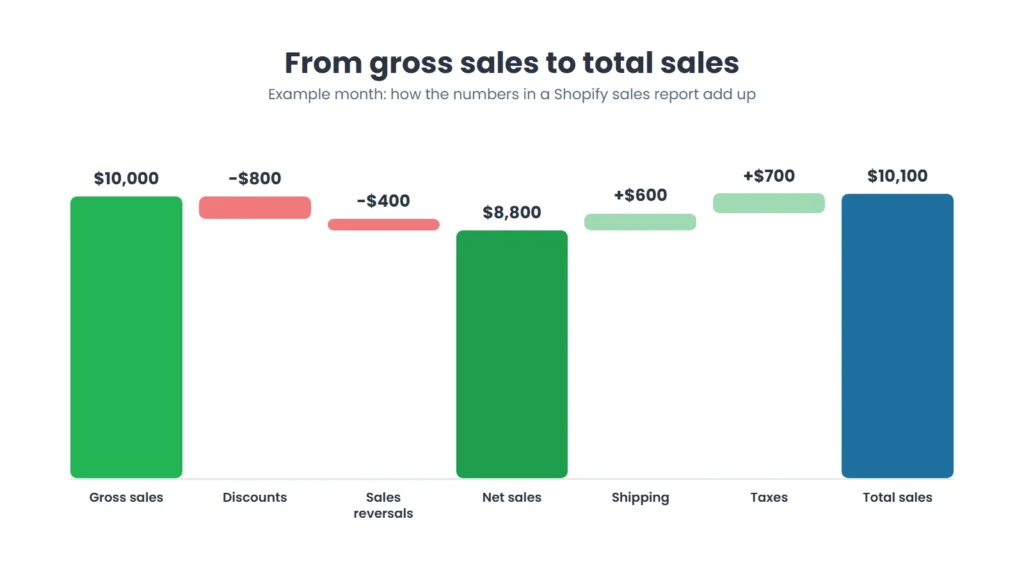
- Net sales = $10,000 – $800 – $400 = $8,800
- Add $600 shipping and $700 taxes
- Total sales = $8,800 + $600 + $700 = $10,100
Net sales is the number to watch for growth. Total sales looks bigger, but part of it is shipping and tax money that is not really yours.
What changed in 2026: returns are now “sales reversals”
Shopify renamed its return metrics. Returns became Sales reversals and Quantity returned became Reversed quantity. The new names cover refunds, cancellations and order edits, not only items sent back.
Shopify’s Help Center says the old return metrics were shown alongside the new ones until May 1, 2026, and then removed. If an old spreadsheet or tutorial mentions a Returns column, look for Sales reversals instead.
Why your Shopify sales report might look wrong
Most “wrong” numbers are not wrong. They come from how Shopify counts sales. Check these before you panic.
- Pending, unpaid and canceled orders are included. Test orders and deleted orders are not.
- Sales are not payments. A sale counts on the day of the order, even if the payout comes later.
- Renamed products can show up twice. Reports keep the product title from the time of each sale.
- Gift card sales are not counted as sales. Purchases paid with a gift card are.
- Total sales by product leaves out shipping, so its total will be lower than Total sales over time.
- Order edits made on a later day show as a separate line in Total sales over time.
- Adding product columns to Total sales over time adds one row per product. An exported CSV can then show more orders than you really had.
How to use your Shopify sales reports: a 15-minute weekly routine
Reports only help if you look at them on a schedule. This routine fits into a Monday morning.
- Open Total sales over time for the last 7 days and compare it with the previous period. Note the change in net sales.
- Open Total sales by product. Check whether your top five products changed.
- Open Sales by discount codes. If a code drove orders but cut margins too deep, pause it.
- Open Total sales by sales channel. Look for a channel that grew or dropped.
- Open Total sales reversals over time. A jump in reversals often points to a product or shipping problem.
- Write down one action for the week, such as restocking a winner or ending a weak promotion.
Doing this by hand means opening five reports every week. That is where keeping your Shopify sales reports in a spreadsheet helps.
How to get Shopify sales reports into Google Sheets automatically
A spreadsheet keeps your history and lets you add your own math. Your team can see the numbers without admin access. There are two ways to get a Shopify sales report into Google Sheets.
Option 1: Export a CSV and import it
Open the report, click Export and download the CSV. Then open Google Sheets and use File > Import. This works, but the sheet goes stale right away, and you repeat the steps every time.
Option 2: Run the report with FlexSync
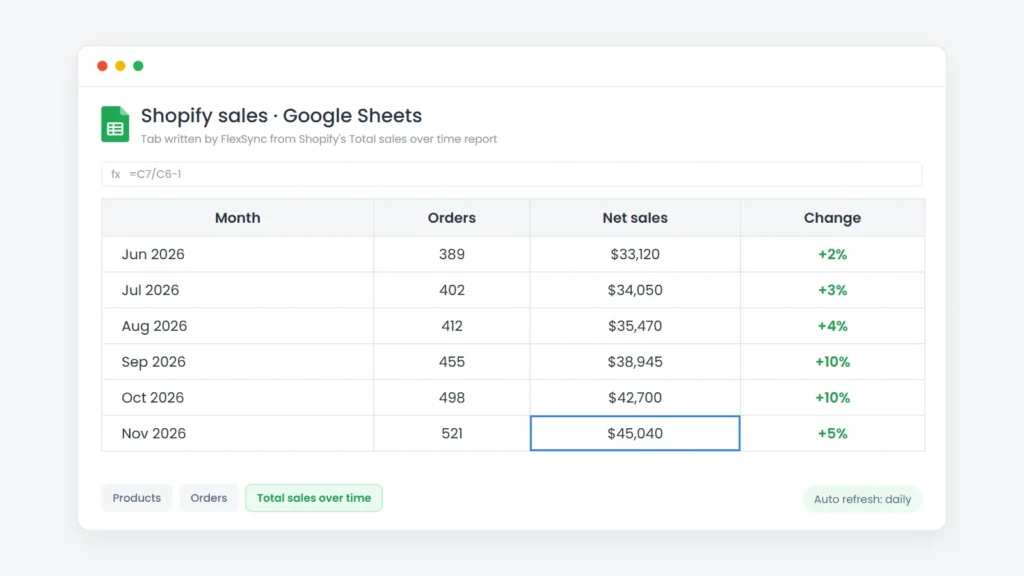
FlexSync is a Shopify app that links your store to Google Sheets. Its Analytics page runs Shopify’s own reports. Each one lands in its own tab in your sheet. The Sales category lists 35 Shopify sales reports, and every report in the table above is there.
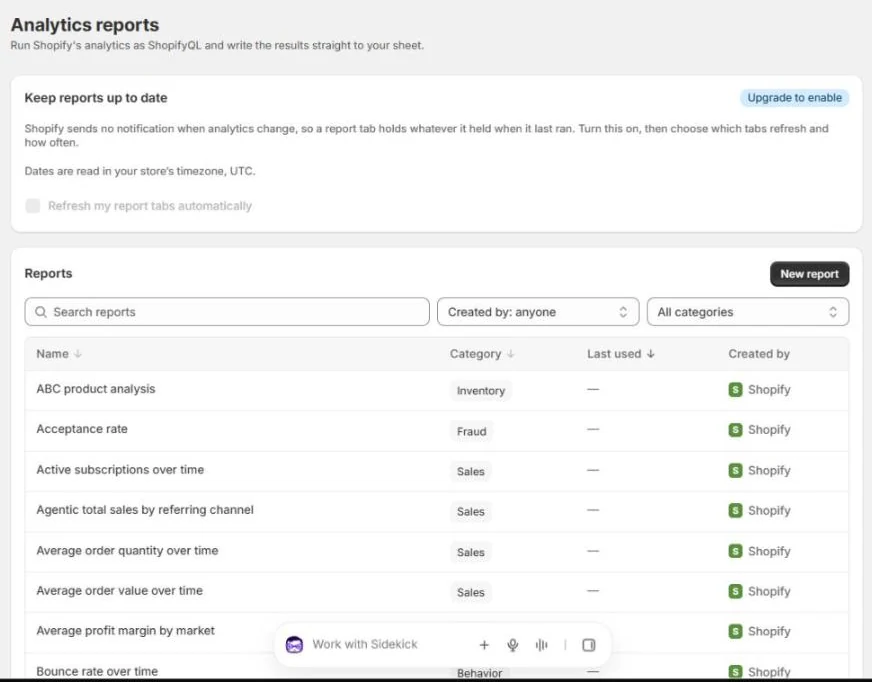
- Install FlexSync and connect Shopify to Google Sheets.
- In your Shopify admin, open FlexSync > Analytics.
- Use Search reports or set the category to Sales.
- Click a report, for example Total sales over time.
- Pick a date range. To compare, choose Previous period, Previous year or a custom range.
- Click Run now. FlexSync writes the results to a new tab with the report’s name.
The full steps, with screenshots, are in the FlexSync guide to exporting Shopify analytics reports.
Keep the tab fresh with auto refresh
Shopify does not tell apps when sales data changes. So a report tab keeps the data from its last run. On FlexSync’s paid plans, turn on Refresh my report tabs automatically and choose hourly, daily or weekly. Dates use your store’s timezone.
On the Free plan, a report writes up to 2 rows and you can keep 1 report tab. Paid plans raise these limits.
Tweak a sales report with ShopifyQL
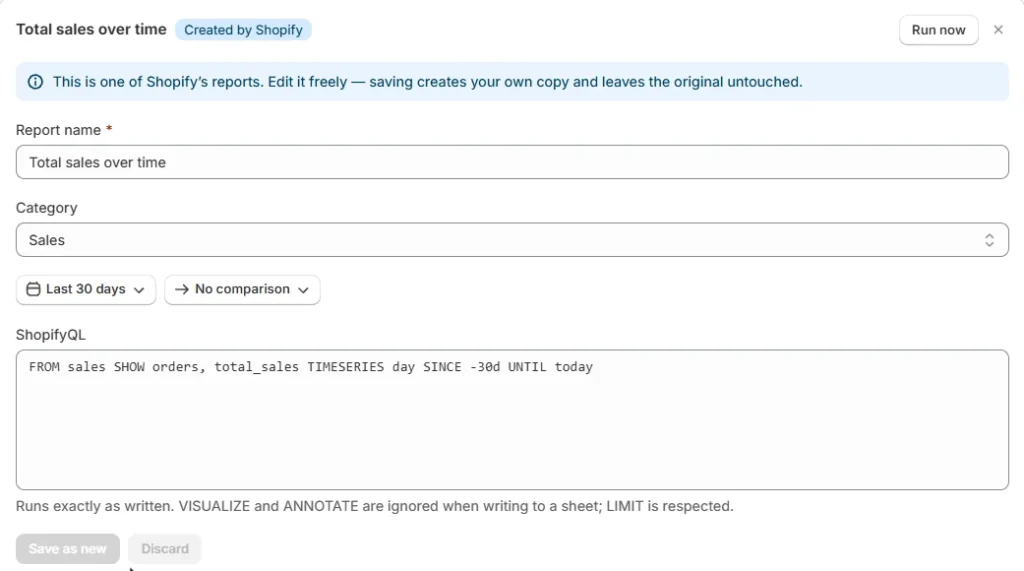
Every Shopify report in FlexSync can be edited. Saving makes your own copy, so the original stays untouched. For example, Total sales over time runs this query:
FROM sales SHOW orders, total_sales TIMESERIES day SINCE -30d UNTIL todayChange day to week and -30d to -90d, then click Save as new. You now have a weekly view of the last 90 days. You can also click New report to write a query from scratch.
Once your sales data sits in a sheet, you can add profit math with Google Sheets formulas for Shopify. You can also keep it next to your Shopify orders in Google Sheets.
Make Shopify sales reports part of your week
Shopify sales reports already hold the answers to most store questions. Learn how gross, net and total sales differ. Check the few reports that matter each week, then act on one finding at a time.
If you want the numbers waiting for you in a spreadsheet, run your Shopify sales reports through FlexSync and let them refresh on their own.
Frequently asked questions
How do I get a sales report from Shopify?
Go to Analytics > Reports in your Shopify admin, filter the category to Sales and open a report. Set the date range, then click Export to download it as a CSV.
What sales reports are available in Shopify?
Shopify includes reports for total sales over time, sales by product, variant, vendor, channel, referrer, billing location, currency, customer and discount code. There are also reports for average order value, sales reversals, bundles and subscriptions.
What is the difference between net sales and total sales in Shopify?
Net sales is gross sales minus discounts and sales reversals. Total sales adds shipping, taxes, duties and fees on top of net sales.
Are Shopify sales reports in real time?
Nearly. Shopify says sales reports are up to date within about one minute. Refresh the report to see the latest orders.
Can I automate Shopify sales reports?
Shopify does not email sales reports on a schedule by default. An app like FlexSync can write a sales report to Google Sheets and refresh it hourly, daily or weekly on paid plans.
Why don’t my Shopify sales match my payouts?
Sales reports count the value of goods sold on the order date. Payouts follow your payment provider’s schedule and fees. Use Shopify’s finance reports to track payments.
